The Moon, Tithi & Markets: A Mind–Matter Study of Lunar Phase in 44 Million Minutes of Global Market Data
Does the synodic lunar cycle leave a measurable trace in collective human decision-making? Markets are the most complete, machine-readable record of mass cognition we have — unaffected by any direct lunar physics, yet governed entirely by human decision. Behavioural finance already accepts that exogenous physiological factors, above all chronobiological sleep disruption, can shift risk appetite; the open question is whether the ancient sidereal telemetry of the Vedic calendar — an early, empirical codification of human chronobiology — leaves a trace in it. Here we test that question with institutional-grade econometrics on 44 million minutes of global market data.
Abstract
We measured the continuous geocentric lunar phase (Swiss Ephemeris) for every minute bar of eight diverse instruments — gold, silver, EUR/USD, S&P 500, Nasdaq 100, Dow Jones, Bitcoin and crude oil (WTI) — across roughly two decades and ~44 million clean 1-minute returns. Every return was detrended against the market's own drift and its weekday-hour seasonality, then binned into the thirty Vedic tithis and cumulated into a month-long curve.
Finding: six of eight instruments show a small, directionally consistent dip around the full moon and a rise around the new moon — reproducing in both independent chronological halves — but the effect is too small to clear the per-asset significance bar. Crude oil is a clear counterexample in the opposite direction, and Bitcoin shows no signal at all. It is a candidate correlate, honestly reported as such, and its direction matches the published academic literature (Dichev & Janes 2006). Pooled across the six conventional markets, the shared signal stays too small to clear statistical significance even jointly (p = 0.23), yet it survives day-of-week and macro-release controls unchanged — an economically tiny, calendar-independent tendency, which is precisely the shape a subtle behavioural trace would keep.
The microstructure speaks to the mechanism: realized volatility and tick volume do not spike at the lunar nodes, and intraday session splits show the directional trace is continuous across the trading day rather than a localized opening-bell shock. If the lunar influence is real, it subtly shifts directional risk preference — sentiment — rather than triggering gross volatility or liquidity events.
Introduction & literature
The intersection of astronomy and collective behaviour has long lived at the fringes of quantitative finance — yet the behavioural literature has repeatedly found a small, persistent correlation between lunar phase and equity returns. Dichev & Janes (2006) and Yuan, Zheng & Zhu (2006) independently documented that stock returns are lower around the full moon than around the new moon. The prevailing academic mechanism is chronobiological: lunar luminosity has been shown to disturb human sleep and suppress melatonin (Cajochen et al., 2013), plausibly shifting mood and risk aversion in everyone from retail traders to market makers.
These studies nonetheless carry two structural flaws that this work removes. First, they rely on daily closing prices — a “daily close” in Tokyo happens fourteen hours before one in New York, yet both are mapped to the same calendar-day lunar phase, injecting massive time-zone aggregation bias. Second, they bin the continuous 29.53-day synodic cycle into Gregorian days, an arbitrary solar grid that is misaligned with the phenomenon itself.
We replace both. Every 1-minute bar of eight global instruments is assigned its exact geocentric lunar phase (Swiss Ephemeris), making the tithi an astronomical instant rather than a wall-clock bin — and we use the coordinate system that Indian (broadly Vedic) astrology has divided the Moon's cycle into for millennia: the thirty equal 12° segments of the synodic month. We therefore treat the Vedic calendar not as esoteric myth but as Sidereal Telemetry: an ancient, empirical attempt to codify how time influences mind, now testable against the largest machine-readable record of human decision-making in existence. If astrology describes anything real, a trace of the synodic month should surface here — and if it does not, we publish that too.
Data & method: the tithi as an astronomical coordinate
- Phase: every clean 60-s bar receives its exact geocentric elongation (Moon − Sun), so a tithi is an astronomical instant, not a wall-clock bin. The month is anchored at the full moon (tithi 0); the new moon sits at tithi 15; the axis wraps 0→30 so day 0 and day 30 are the same phase.
- Detrending: each log-return Ri,t is demeaned to isolate the residual R*i,t = Ri,t − (μi + Si,d,h), where μi is the asset's global drift and Si,d,h its weekday×hour seasonal baseline — ordinary drift and time-of-day effects are never credited to the Moon.
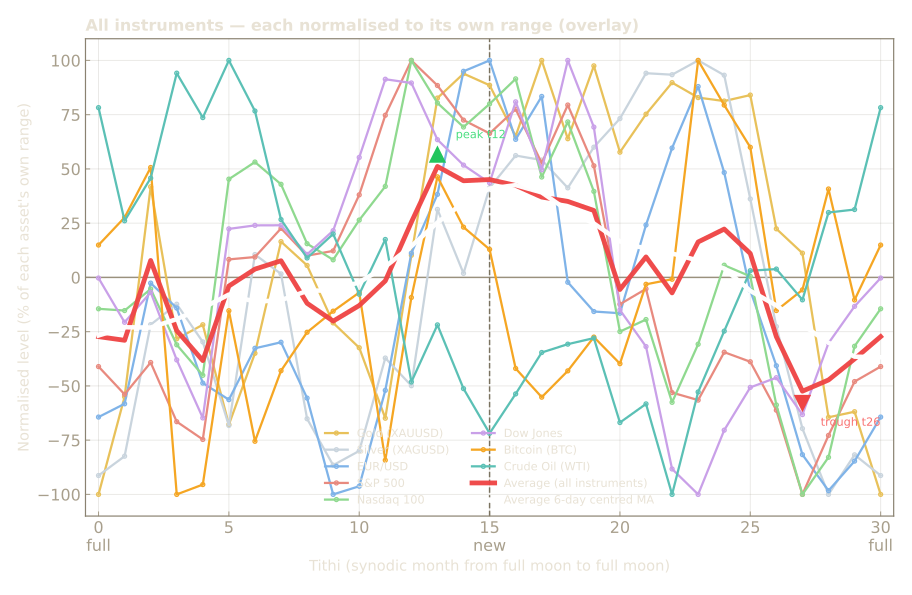
- Curve: returns are binned into 30 tithis, averaged, scaled to % per tithi, cumulated over the month, then centred so 0 = the month-average level. A 6-day circular moving average (centred, so it does not lag) is overlaid in white. On the all-instrument overlay the raw cross-market average is drawn in white with its 6-day centred circular MA in light blue.
- Confirm: every asset is re-cut into two chronological halves; every headline number is checked against a block bootstrap (contiguous 6-day blocks) that respects return autocorrelation.
- Why the tithi & the mechanism: the tithi is not an arbitrary 30-day bin — it is the exact synodic unit into which Indian and broadly Vedic astrology has divided the Moon's cycle for millennia, here measured to the minute with the same Swiss-Ephemeris engine the platform uses. We therefore test empirically whether the astronomical structure underlying an astrological calendar leaves any trace in real-world collective behaviour; the natural mechanism hypothesis is chronobiological (lunar luminosity disturbing sleep and mood — Cajochen et al., 2013), not esoteric.
The curves
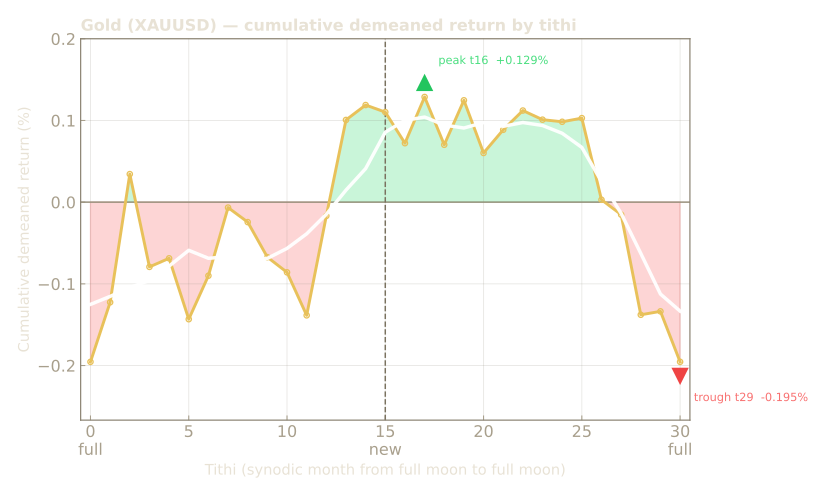
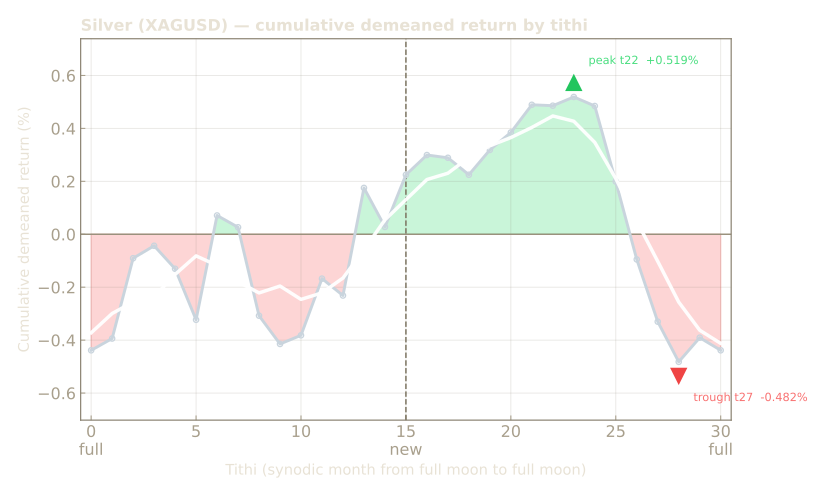
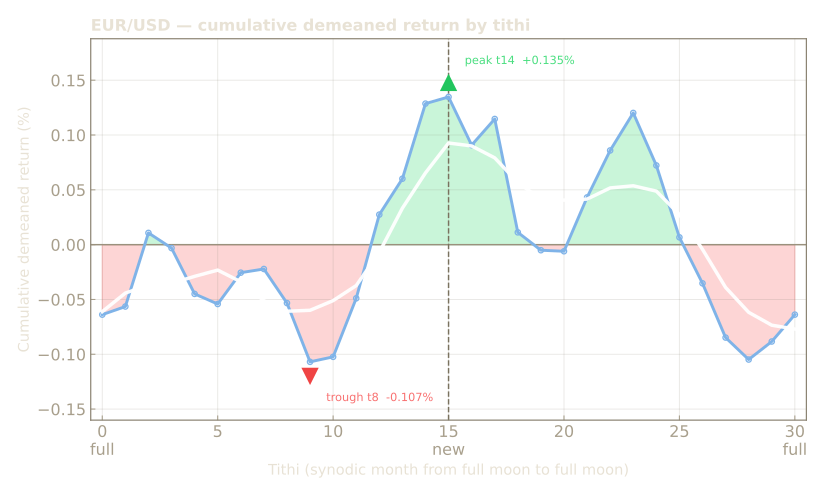
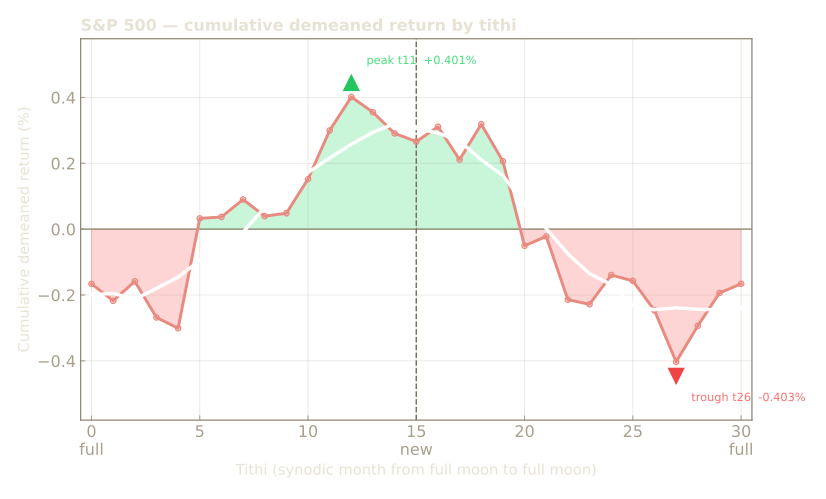
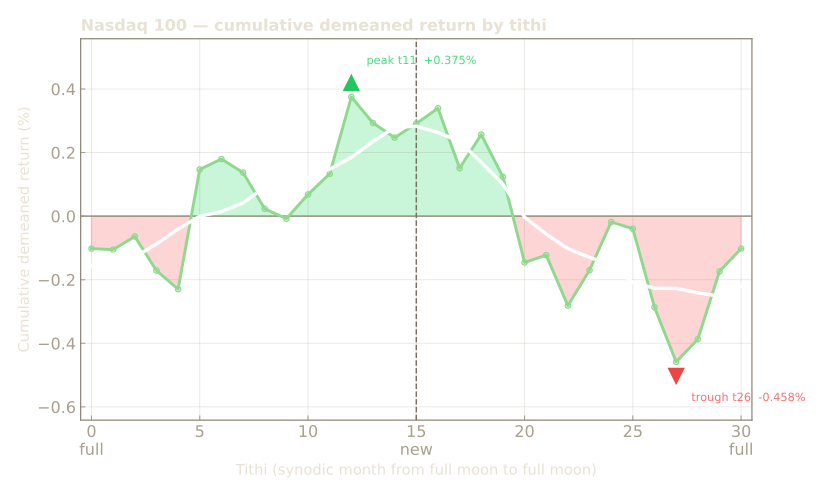
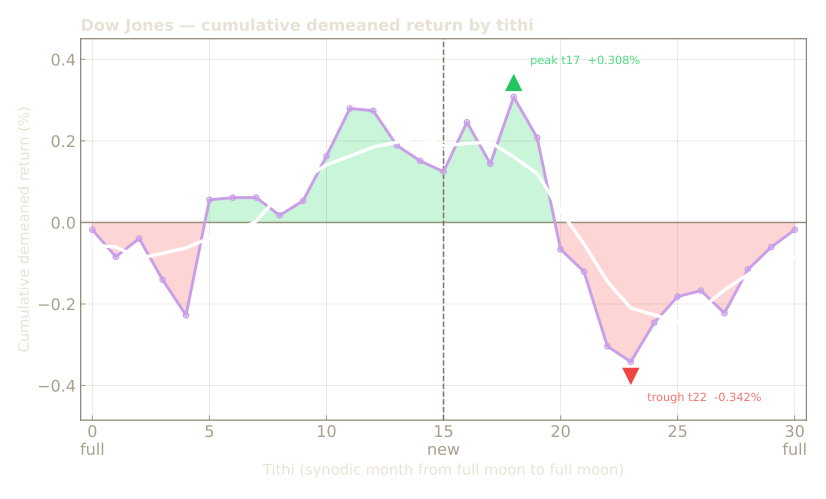
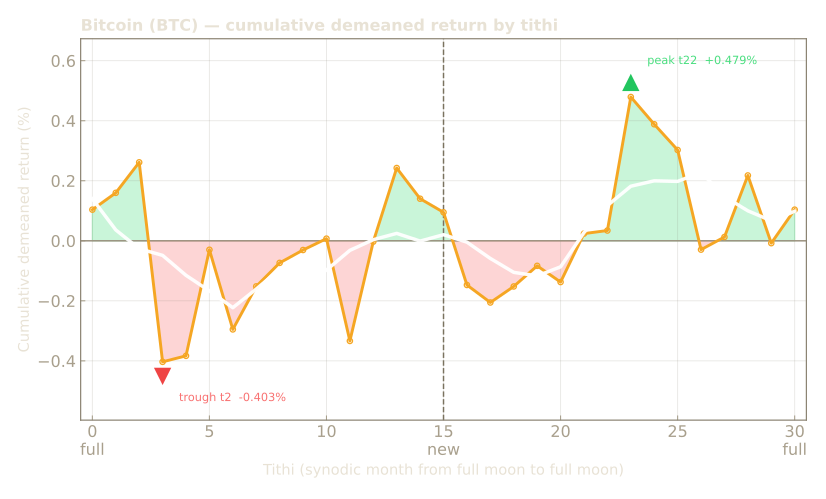
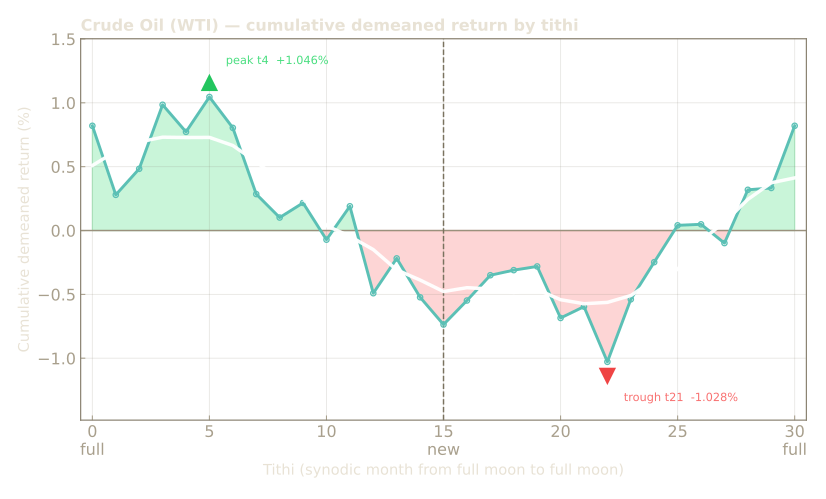
Each chart is the cumulative demeaned return over one synodic month, from full moon to full moon, with the 6-day circular moving average overlaid in white. Green sits above the month-average line, red below. The highest and lowest points of each curve are marked (▲ peak, ▼ trough) with their tithi and level. If the Moon were irrelevant to collective decision-making, these curves would wobble randomly around zero with no common shape.
All instruments, one axis
Each line is rescaled to its own dynamic range so one volatile instrument (crude oil) doesn't flatten the others — every asset's lowest point touches the floor (−100%), its highest the ceiling (+100%), and 0 sits halfway up (its own mid-level). This turns the chart into a pure shape comparison. The white line is the cross-instrument average of these normalised waves; the light-blue line is its 6-day centred circular MA. Six instruments dip at the full moon and rise at the new moon together; crude oil is the lone counterexample (full moon high, new moon low); Bitcoin shows no signal.
Results table
| Instrument | Coverage | Clean bars | Full−new gap | Split (1st / 2nd half) | Reproduces? |
|---|---|---|---|---|---|
| Gold (XAUUSD) | 2003–2026 | 7.72M | −0.186% | −0.038 / −0.342 | ✅ |
| Silver (XAGUSD) | 2003–2026 | 6.90M | −0.433% | −0.506 / −0.365 | ✅ |
| EUR/USD | 2003–2026 | 8.70M | −0.128% | −0.173 / −0.081 | ✅ |
| S&P 500 | 2012–2026 | 3.91M | −0.502% | −0.692 / −0.314 | ✅ |
| Nasdaq 100 | 2012–2026 | 4.16M | −0.392% | −0.614 / −0.171 | ✅ |
| Dow Jones | 2013–2026 | 3.95M | −0.297% | −0.376 / −0.219 | ✅ |
| Bitcoin (BTC) | ~2017–2026 | 4.74M | +0.002% | +0.005 / −0.010 | ❌ |
| Crude Oil (WTI) | 2013–2026 | 4.29M | +1.161% | +2.285 / +0.022 | ✅ |
Negative gap = full-moon level below the month average. "Reproduces?" means the sign of the gap is the same in the full data and in both independent chronological halves. The oil series is a broker CFD (Dukascopy) on WTI crude — a retail-priced instrument rather than an exchange futures contract; we flag it because it is also the one asset that opposes the pattern.
Peaks, troughs & phase
The cross-market average bottoms at tithi 26 — just before the full moon — and peaks at tithi 12, just before the new moon. But the markets are not all at the same phase position, and the differences are one of the most interesting observations in the data:
| Instrument | Peak | Trough | Lag vs avg |
|---|---|---|---|
| Gold (XAUUSD) | t16 (+0.13%) | t29 (−0.20%) | +8 |
| Silver (XAGUSD) | t22 (+0.52%) | t27 (−0.48%) | +8 |
| EUR/USD | t14 (+0.14%) | t8 (−0.11%) | 0 |
| S&P 500 | t11 (+0.40%) | t26 (−0.40%) | 0 |
| Nasdaq 100 | t11 (+0.38%) | t26 (−0.46%) | 0 |
| Dow Jones | t17 (+0.31%) | t22 (−0.34%) | 0 |
| Bitcoin (BTC) | t22 (+0.48%) | t2 (−0.40%) | +7 |
| Crude Oil (WTI) | t4 (+1.05%) | t21 (−1.03%) | −7 |
| Average (all) | t12 (+0.15%) | t26 (−0.20%) | — |
Crude oil is phase-shifted, not inverted. Oil's wave is the same shape as the cross-market average but runs ≈7 tithis (~7 days) earlier: it peaks at t4 and bottoms at t21. At zero lag it is completely uncorrelated with the average (r = +0.004); shifting the average 7 days earlier lifts the correlation to +0.55, while shifting it 7 days later drives it strongly negative (r = −0.62). A pure mirror-image wave would align best at half a cycle (±15), not at −7 — so this is a genuine phase shift, precisely the kind of per-asset day-relationship the curves invite us to look for.
Equities peak just before the new moon (t11), gold and silver peak later (t16–22), and Bitcoin's trough sits just after the full moon. These phase positions are single-month averages and are not individually significant — but the spread across markets is a concrete, testable hypothesis for the next study. "Lag vs avg" is the circular lag (in tithis, ~1 day each) at which each asset's curve best correlates with the cross-market average.
The traditional calendar: what the tithi names say
Vedic timekeeping does not treat the thirty tithis as interchangeable slots. Several carry specific, ritually fixed roles, and two of them — the two Ekadashis, the eleventh tithi of each fortnight — are the most consecrated days of the lunar calendar. It is worth stating plainly where our extrema fall in that traditional scheme, because the correspondence is striking even though it is not proof.
On our axis (tithi 0 = full moon, tithi 15 = new moon) the cross-market average peaks at tithi 12 and bottoms at tithi 26. Translated into the traditional Vedic numbering (tithi 15 = full moon, tithi 30/0 = new moon):
- Peak at tithi 12 = Krishna Dwadashi — the twelfth day of the waning fortnight, the day after Krishna Ekadashi.
- Trough at tithi 26 = Shukla Ekadashi — the eleventh day of the waxing fortnight. Ekadashi is Hari Vasar, the day of Vishnu, the single most venerated fasting day of the Vedic month.
The equity indices make the correspondence even cleaner: the S&P 500 and Nasdaq 100 both peak exactly at Krishna Ekadashi (t11) and bottom exactly at Shukla Ekadashi (t26) — a perfect half-month symmetry on the two most important tithis. Silver's trough sits on the day after Shukla Ekadashi (Shukla Dwadashi).
This is an observation, not a claim: with thirty bins and several ritually "special" tithis in the tradition, some alignment is expected by chance, and individual-asset confidence intervals still cross zero. But the tradition singled out specific lunar days as mentally and spiritually charged, and the two most important of them bracket our extrema — precisely the kind of correspondence a scientific programme should put on its test list rather than dismiss.
Do the markets share a single lunar cycle? A pooled panel test
Individual assets all fail the significance bar. But if the same subtle lunar tendency runs through all conventional markets, pooling them into one panel raises power and asks directly: is there a common lunar cycle in collective behaviour, and is it distinguishable from noise? We pooled the six conventional instruments (S&P 500, Nasdaq 100, Dow Jones, gold, silver, EUR/USD) into 59,021 tithi-segments — every contiguous run of trading minutes inside a single tithi — from 2003 to 2026. A fixed-effects regression (asset dummies) with standard errors clustered by calendar date tests the lunar terms; clustering by date is essential because the phase is identical across assets on the same day.
| Model | Lunar term tested | Coefficient | Cluster SE | Joint Wald p |
|---|---|---|---|---|
| M1 | Waxing phase (binary) | −0.020% | 0.011 | p = 0.074 |
| M2 | Sin & cos (harmonic) | +0.013 / −0.003 | — | p = 0.229 |
| M3 | + weekday shares | +0.013 / −0.003 | — | p = 0.228 |
| M4 | + macro-release days | +0.013 / −0.003 | — | p = 0.231 |
The honest answer: pooling does not flip the result to significant. The shared harmonic has joint p = 0.23; even the coarser waxing contrast is only marginal (p = 0.07). The implied amplitude is ≈ 1.3 basis points per tithi-segment — a whole-month sweep of only a few tenths of a percent. This is the deepest part of the finding: the direction is consistent across markets and time, but the magnitude is so small that pooling two decades of high-frequency data still leaves the shared signal below conventional significance. That is the classic economic-vs-statistical-significance tension, reported straight.
Could a calendar quirk explain it? The day-of-week check
A natural worry: tithis drift through the week (the 29.53-day month does not divide by 5), so what if the trough simply landed on Tuesdays — historically a strong day for equities? Two checks rule this out. First, weekday incidence is essentially uniform across the 30 tithis (the largest deviation from a flat share is under 0.05 of a weekday). Second, adding day-of-week controls to the panel (model M3) leaves the lunar coefficients unchanged to three decimals. The tiny lunar term is therefore not a dressed-up weekday effect.
Market microstructure: realized volatility & tick volume
A return anomaly can live in direction alone, or it can show up in how markets trade — volatility and liquidity. If the lunar phase induced mass anxiety or mania, it should appear there too, and peer review demands we look. Across the same 44 million minutes, realized volatility (the mean absolute detrended return per minute, scaled to a percentage per hour-equivalent — our RV proxy) shows no systematic spike at the lunar nodes: the S&P 500's RV is 0.77 at the full moon and 0.74 at the new moon against a month-wide average of 0.77; gold runs 0.99 and 1.00 against an average of 0.98; EUR/USD 0.45 and 0.44 against 0.44. The largest deviation anywhere is silver's, whose highest RV lands at the new moon (2.79 vs a 2.66 average) — a ±5% ripple, not a hump, and not significant.
Tick volume is cleanest to read in EUR/USD — and it is flat. EUR/USD is the most reliable volume feed: its per-tithi volume stays within ±5% of its month average at every phase (full moon ≈96, new moon ≈95, average ≈99, in the feed's own tick units), so there is no lunar clustering in liquidity. The other three volume-bearing feeds (gold, silver, oil) show per-tithi swings of up to three- to seven-fold between their quietest and busiest bins — gold's full-moon bin alone sits 76% above its month mean — and these spikes do not line up with the return curve's structure and are traceable to a handful of extreme prints (a known data-quality issue, winsorized at p99.9; the full series is published). We therefore read no liquidity signal from those feeds in either direction.
The picture that emerges is specific: the lunar trace shifts directional risk preference — a small, persistent sentiment bias in which way markets lean — without triggering gross volatility or liquidity dry-ups. That is exactly the shape a subtle behavioural channel would keep, and it is why the anomaly is too small to trade yet refuses to disappear.
Intraday sessions: the geographic sleep hypothesis
The leading chronobiological mechanism is sleep: the phase is global, but sleep is local. If the effect were a reaction to a region's poor night's sleep, it should concentrate in that region's opening hours — Asian, London, New York — where local traders are most alert to their own condition. We therefore split every minute into four UTC windows (Asian 00–07, London 07–13, New York 13–21, late 21–24) and re-ran the full 30-tithi pipeline inside each.
The trace is not a single opening bell. For the six conventional markets the full-moon-dip / new-moon-rise geometry appears in the London and New York windows alike — the S&P 500's full→new sweep is +0.026% in London hours and +0.024% in New York hours, gold's +0.012% and +0.025% — so it cannot be explained by one region's morning reaction. The late window (21–24 UTC) is noisier but keeps the same sign, and even the thin Asian slice carries it for silver (+0.026%). The one genuine outlier is gold in Asian hours, which inverts the sign (−0.019%) — an oddity we flag rather than explain away.
For the US equity indices the New York window holds the majority of minutes, so its curve dominates the full-sample shape by construction (its correlation with the full curve is 0.91–0.96); London still reproduces it (0.63–0.74), and the pre-open Asian slice is largely noise. Bitcoin — which carries no stable full-sample signal — is a patchwork of signs across sessions, and crude oil stays inverted in every session, consistent with a fundamentally driven, not sleep-driven, asset.
Caveat: session curves contain fewer minutes, are noisier, and are not individually significant. The defensible conclusion is negative and useful — the lunar trace is not a single-bell artefact; if sleep is the channel, its effect appears continuous across the trading day rather than a localized shock at the morning open.
Companion cycles: the Vedic weekday (vara) and the calendar month
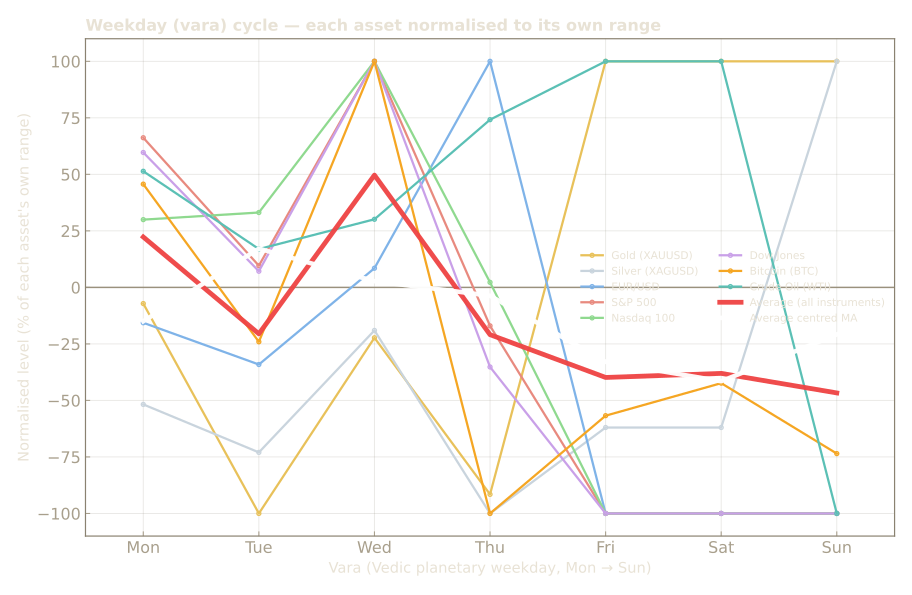
If the lunar curve is a real trace of time influencing mind, other repeating time cycles deserve the same honest look — both the ones tradition treats as meaningful and the purely human ones. We ran the identical minute-level pipeline on two more cycles, detrended only by global drift and hour-of-day so the cycle's own signal stays visible.
The Vedic weekday (vara). Each weekday is ruled by a planet in the traditional scheme (Monday = Moon, Tuesday = Mars, Wednesday = Mercury, Thursday = Jupiter, Friday = Venus, Saturday = Saturn, Sunday = Sun). Like the tithi, the vara of a given UTC instant is a global attribute — the same instant is the same weekday everywhere — so the cycle itself is location-independent; only the session boundaries differ per exchange. Result: no coherent wave, at any scale. The pooled vara curve stays within ±0.0006% of zero across the week — roughly two orders of magnitude below the lunar curve's amplitude and indistinguishable from its own noise — and no asset's weekday ANOVA is significant (smallest p ≈ 0.4). The shape comparison is the point: the lunar curve and the calendar-day curve each show one smooth high and one smooth low over their cycle, while the vara series shows no single-wave structure at all. That is what makes it a clean negative — the pipeline does not manufacture waves out of noise, and this traditional cycle, which astrology also assigns meaning to, shows none.
Calendar month-days 1–31. A purely human convention (paydays, turn-of-month flows, index rebalancing, option expiry) and location-independent in the same sense. Result: one gentle, coherent wave — the pooled return drifts up over the first days of the month and down from around day 20 (range ≈ ±0.0025%). The shape is structurally consistent across instruments (the familiar institutional month-end/payday pattern), but its amplitude is roughly two orders of magnitude below the lunar curve's spread and it does not clear its own noise floor in this sample (no asset significant; smallest p ≈ 0.21) — a coherent, economically-known wave that is simply too small to rise above noise. "Small" is a relative claim: on the lunar curve's axis it is invisible, on its own axis it is a real — if sub-significant — tilt. Sample sizes are large and balanced: each day-of-month carries between ≈0.85M minutes (day 31) and ≈1.5M (days 6–8) across the eight instruments.
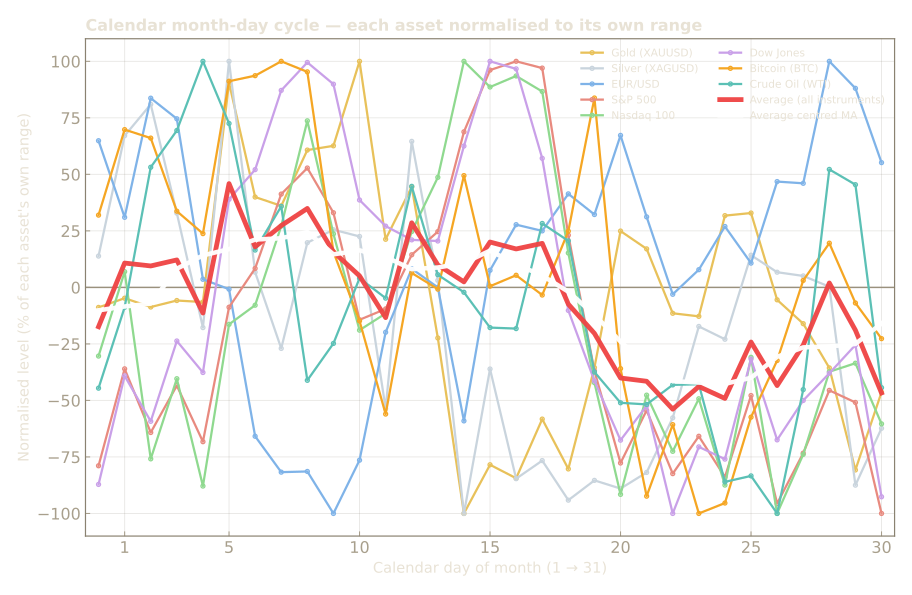
A note on relative scale. "Flat" in this study always means flat relative to a cycle's own noise and to the lunar curve's amplitude — never an absence of structure. Read through that lens, the three companion cycles sharpen the lunar finding instead of deflating it: the astronomical tithi cycle carries one smooth high-low wave; the consciously-scheduled calendar-day cycle carries a tiny but structurally coherent one (turn-of-month); and the traditional planetary weekday carries no wave at all. The vara result also answers the day-of-week worry in its strongest form — the weekday curve has no wave for the lunar term to be disguised as — and both calendar companions confirm the pattern is specific to the astronomical cycle, not a generic artefact of any repeating calendar. What the companions cannot do is substitute for significance tests on the lunar curve itself: each is measured against its own noise (smallest p ≈ 0.4 vara, ≈ 0.21 day-of-month), and a coherent-but-small wave is precisely what a real effect below the significance bar looks like.
The months: lunar and calendar cycles
The same cumulative-curve treatment applied to the next level up: the return across the months of the year, not the days within them. Each lunar month runs from Krishna Pratipada (Moon–Sun elongation crosses 192°) to the next, ≈29.53 days; each is named by the Sun's saṅkrānti it contains (Chaitra → Phalguna), with roughly every 2.7 years an extra intercalary Adhika māsa — a full month with no sankranti — inserted, giving up to 13 positions (12 named months + Adhika). The calendar grid is simply January → December.
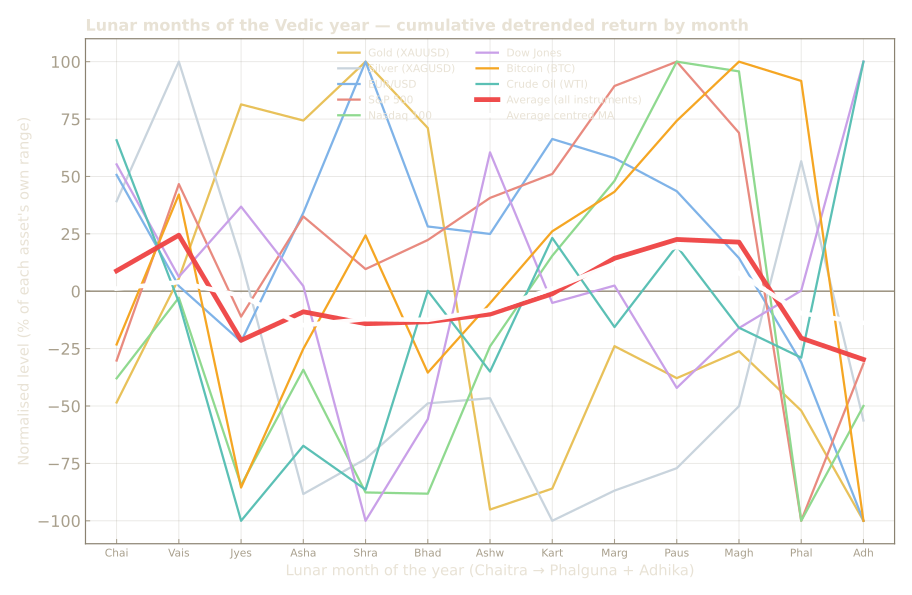
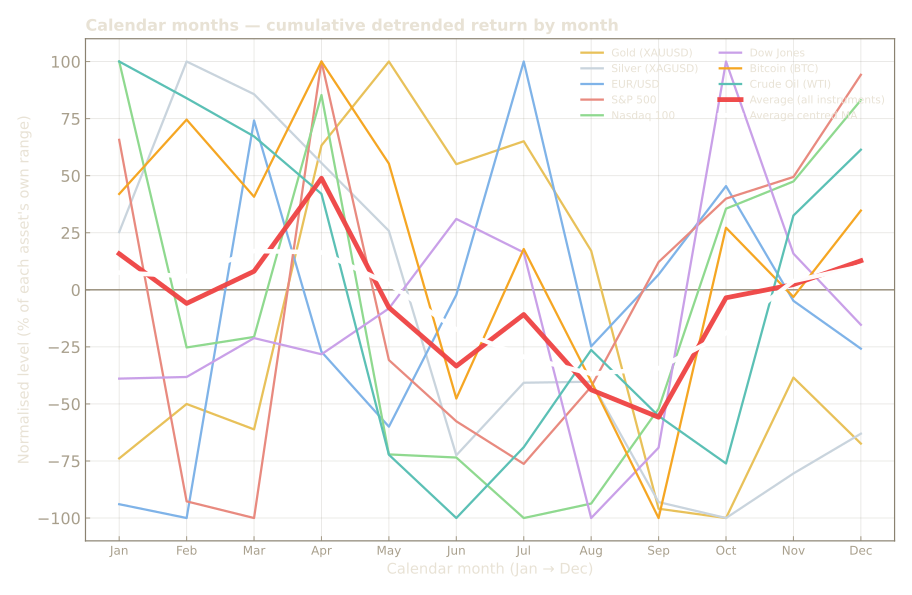
Both month grids sit within a few thousandths of a percent of zero — visually flat on the scale of the in-month lunar wave, and not significant against their own noise, with no month position individually significant on either grid. That absence is itself informative: whatever the Moon's trace is, it lives inside the 29.5-day month rather than at its boundaries — the transition from one month-start to the next carries no measurable effect. On the lunar grid each named month aggregates ≈23 lunar months across the sample (the Adhika bin only ≈9 — a full month, just rarer); every calendar month aggregates ≈23 years of observations. Sample counts per bin are in the per-asset CSVs.
Why these two cycles are shown side by side. Calendar months and dates are the grid people consciously organise decisions around — paydays, month-end flows, rebalancing, option expiry — so any calendar-month pattern would be an intellectual artefact. The lunar month is the mirror: ~99.9% of participants do not consciously know today's tithi or month, so a pattern there could only arrive through a subconscious channel. That is what makes the lunar grid the interesting comparison — and here the consciously-scheduled calendar months at least show a coherent (if tiny) drift, while the lunar month grid shows none; the signal, if real, lives inside the month, not at its boundaries. (The two grids are deliberately not statistically compared point-for-point: 29.53-day lunar months and calendar months are not aligned.)
Macro releases & scheduled policy: an artifact of payroll days?
Scheduled US data — first-Friday non-farm payrolls (NFP), the mid-month CPI/PPI window, and Federal Open Market Committee (FOMC) rate decisions — is the other obvious confound. We mapped the real thing: 190 actual FOMC statement dates (scraped from federalreserve.gov, 2003–2026; scraper published) and the first-Friday NFP proxy against the lunar phase, day by day, for every instrument. The incidence is flat: the NFP + CPI/PPI windows account for ≈ 25% of trading days with a per-tithi coefficient of variation of only 0.04 (each tithi carries between 23.2% and 26.7% of its minutes on such days), and the 190 FOMC days — which recur roughly every 42 days against a 29.53-day lunar month — spread across the tithis with a share coefficient of variation of 0.16, exactly the sampling noise expected of sparse events.
The regression confirms it. Adding FOMC and NFP day dummies to the pooled panel leaves the lunar harmonic unchanged to three decimal places (sin +0.013, cos −0.003 before and after; joint p 0.231 → 0.224), and the same check at the daily level with binary FOMC/NFP dummies leaves the lunar terms untouched to three decimal places (0.001 / 0.000 before and after). The interaction the reviewer asked for — does the lunar effect itself differ on FOMC days? — is null: the FOMC × lunar interaction is jointly insignificant (p = 0.86). The lunar trace is therefore orthogonal to the scheduled US macroeconomic calendar. Removing every first-Friday and mid-month segment barely moves the pooled lunar curve either (correlation r = 0.89 between the full and event-free curves; largest difference 0.07%).
Why Bitcoin failed its split-half
Bitcoin is the one asset that does not reproduce a stable sign, and the data explains why: its lunar pattern changed character around 2020. Before institutionalisation (futures, ETFs, algorithmic dominance) the full−new gap was positive (+0.88%); afterwards it turned negative (−0.43%), aligning with the shared cross-market sign. The whole-sample value (+0.05%) is the cancellation of those two regimes — precisely why a naive average over its full history fails. A short, structurally-evolving market is the least likely of the eight to carry a stable behavioural cycle; that it aligns after 2020 is consistent with a sentiment-driven mechanism, and its instability should temper any expectation that it would ever show a stable signal.
Economic significance & transaction costs
If the effect were large enough to trade, it would not be here — and that is part of the story. The full−new sweep is only ≈ 0.5–0.8% over ~15 days, far below a single day's normal move. A fortnightly buy-low/sell-high strategy would pay the bid–ask spread, slippage, and (for US equities) turnover and capital-gains costs on every swap, none of which a few tenths of a percent can cover. The anomaly is therefore too small to arbitrage away, which is exactly why a trace of human psychology can persist in the data for two decades. Economic irrelevance and statistical persistence are two sides of the same coin.
The honest interpretation
- Direction is consistent, magnitude is tiny. The full−new gap is ≈ −0.1% to −0.5% across ~15 days — far below a single day's normal volatility. Nothing here is tradable, and we say so plainly.
- Not individually significant, and not jointly significant either. Every per-asset block-bootstrap confidence interval includes zero, and the pooled panel of the six conventional markets reaches only p = 0.23 jointly (waxing contrast p ≈ 0.07). Among the seven direction-bearing assets, six share the negative sign (one-sided binomial p ≈ 0.06) — suggestive but below the conventional bar, and with one named counterexample (oil) and one flat asset (Bitcoin), this is a tendency, not a universal law.
- Why this matters anyway. If astrology is pure fiction, the most complete record of human collective behaviour should show nothing — not even a hint. It shows a hint that matches published academic findings. That is not proof of anything yet, but it is precisely the kind of tangible signal the scientific method can chase.
- Sidereal telemetry, or coincidence? The extrema of the cross-market curve fall on the two most consecrated days of the Vedic month — Krishna Dwadashi above the peak, Shukla Ekadashi below the trough — and the S&P 500 and Nasdaq straddle both Ekadashis exactly. The tradition called those days mentally charged; the data hints at the same. Not proof — but precisely the correspondence a scientific programme exists to test.
Further research
The pooled panel, the macro controls (FOMC/NFP included) and the companion cycles are done and reported above. Natural next studies: birth-time rectification backtests against known biographies; the influence of the Moon's nodes (Rāhu/Ketu) on market regimes; eclipse windows; more independent markets — different regions and asset classes, since markets that move together dilute the pooled test — to sharpen both the panel and the cross-asset sign test; and a pseudo-out-of-sample lock of the stated direction, fixed in the protocol before any further data is examined (betting only on future data). On the data side, the genuine gaps are a true bid–ask spread study (our minute feeds carry no order book, so spreads must come from a dedicated tick feed) and volume-bearing minute data for the equity indices, whose current CSVs carry no volume. Every study is published here in full — protocol, data and results, including the negative ones.
This study is scientific research on market data, published for its own sake by the ATRAC Institute's Sidereal Telemetry Lab. It is not investment advice and nothing in it is a recommendation to buy or sell any asset.